
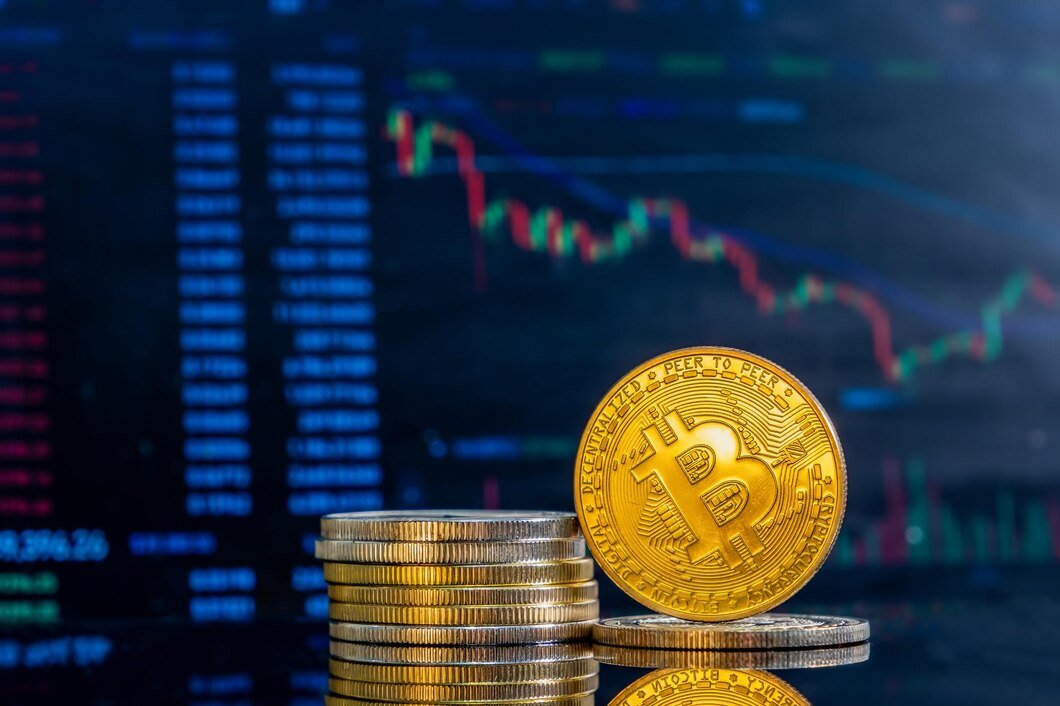
Bitcoin Price Stagnates Amid Conflicting Market Forces
Bitcoin’s price has been oscillating within the $82,400 – $85,300 range since March 14, with both bullish and bearish breakout attempts proving short-lived. This ongoing consolidation highlights the tug-of-war between opposing market forces, preventing BTC from establishing a clear trend.
Table of Contents
Key Factors Behind Bitcoin’s Flat Price Action
1. Uncertain US Economic Policies
The unpredictability of US economic policies has kept investors cautious, limiting fresh capital inflows into the crypto market. Mixed signals from the Federal Reserve and other policymakers have created a fog of uncertainty, leaving Bitcoin range-bound.
2. Lack of New Capital Inflows
Market data indicates a decline in new investments, with fewer fresh capital injections propping up BTC. This reduced liquidity makes it harder for Bitcoin to break out of its current range.
3. Technical Market Setups
BTC’s price is caught in a technical consolidation pattern, with resistance capping upward momentum and support preventing deeper declines. This tight range reflects growing indecision among traders, stalling major price movements.
Bullish Catalysts Supporting Bitcoin
Despite the stagnant price action, several bullish signals indicate underlying optimism:
✅ Federal Reserve’s Dovish Stance:
On March 19, the Fed kept interest rates steady at 4.25% – 4.50% and announced a slower balance sheet runoff. This signaled a potentially looser monetary policy ahead, briefly lifting market sentiment.
✅ Trump’s Pro-Bitcoin Policies:
President Donald Trump declared the US the “undisputed Bitcoin superpower” and advocated for pro-crypto policies, including stablecoin regulations. This political shift bolstered confidence in Bitcoin’s long-term outlook.
✅ Institutional Demand Remains Strong:
MicroStrategy, a major institutional BTC holder, added 130 BTC for $10.7 million, bringing its total holdings to 499,226 BTC. This demonstrates continued institutional appetite for Bitcoin, reinforcing long-term confidence.
✅ Bitcoin as a Strategic Asset:
Senator Cynthia Lummis proposed selling part of the US gold reserves to acquire 1 million BTC over five years. This bold move highlights a growing recognition of Bitcoin as a strategic reserve asset.
Bearish Signals Weighing on Bitcoin
However, several bearish factors continue to offset the bullish momentum:
❌ Rising Stagflation Concerns:
Despite the Fed’s dovish tone, it raised its 2025 inflation forecast to 2.8% (up from 2.5%) and cut GDP growth projections to 1.7% (down from 2.1%). This signals mounting stagflation risks, which could pressure risk assets, including Bitcoin.
❌ Short-Lived Post-FOMC Rally:
Bitcoin’s brief breakout following the FOMC meeting quickly fizzled out, with the price falling back into the narrow range. This highlights a lack of strong conviction among traders.
❌ Trade War Tensions:
Ongoing trade disputes and tariff uncertainties continue to create market headwinds. The lack of a clear resolution is keeping risk appetite subdued.
❌ ECB’s Warning on Crypto Risks:
A European Central Bank (ECB) official warned that Trump’s pro-Bitcoin stance could potentially trigger a global financial crisis, creating uncertainty around the future regulatory environment.
Liquidity Crunch Stagnates Bitcoin’s Momentum
A contraction in liquidity and declining speculative activity are further preventing BTC from making decisive moves.
🔍 On-Chain Insights:
- Realized Cap Growth: Bitcoin’s realized cap is growing at only +0.67% per month—far below the 13.2% growth seen in December—indicating weak capital inflows, according to Glassnode.
- Declining Short-Term Trading Activity: “Hot Supply” (BTC held for one week or less) has dropped by over 50%, signaling a sharp decline in short-term speculative trades.
- Falling Exchange Inflows: Daily exchange inflows have plummeted from 58.6K BTC/day to 26.9K BTC/day—a 54% drop—further highlighting reduced trading activity.
These metrics suggest that Bitcoin’s market is shifting from a profit-driven phase to a neutral equilibrium, capping both upside and downside volatility.
Technical Analysis: BTC Stuck in Ascending Triangle
Bitcoin’s price is consolidating within an ascending triangle pattern, marked by:
- A horizontal resistance level acting as a ceiling.
- An ascending trendline providing consistent support.
Key Technical Takeaways:
📌 Resistance Capping Upside: The upper boundary of the ascending triangle is acting as a strong ceiling, preventing sustained upward breakouts.
📌 Support Preventing Deeper Pullbacks: The ascending trendline offers consistent support, preventing significant price drops.
📌 Failed Breakouts Indicate Weak Momentum: Recent upside breakout attempts have failed, including false breakouts above the resistance trendline.
The tightening range reflects mounting indecision, making BTC vulnerable to a sharp move once either the resistance or support is decisively breached.
What the Ascending Triangle Means for BTC
An ascending triangle is typically viewed as a bullish continuation pattern during a broader uptrend.
📈 If BTC Breaks Above the Resistance:
The price could rally by an amount roughly equivalent to the triangle’s maximum height.
📉 If BTC Falls Below the Support:
A downside break could signal a bearish reversal, pushing prices lower.
✅ Key Takeaway: Bitcoin Remains Range-Bound for Now
Bitcoin’s price continues to oscillate in a narrow range, driven by conflicting macroeconomic signals, shrinking liquidity, and technical consolidation. Until a decisive breakout occurs, BTC is likely to remain trapped between $82,400 and $85,300.
Read Also: Will XRP Price Crash Again?
Comments are closed.